How to Diagnose Website Downtime Before Filing a Support Ticket
A triage checklist for diagnosing website downtime before filing a support ticket. Find out if the fault is DNS, routing, or the server itself.
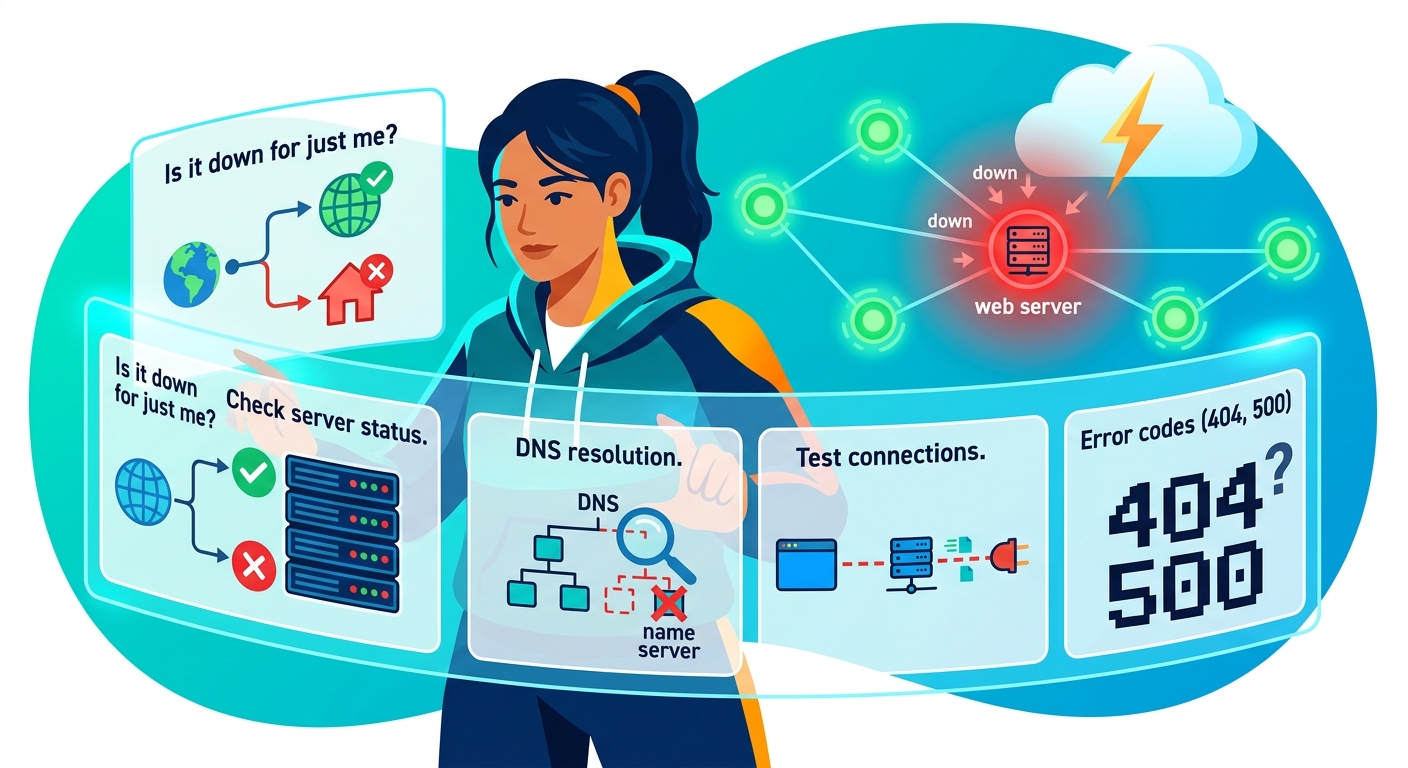
Your site isn't loading. Your phone is buzzing. Someone Slack-messaged you "is the site down?" before you finished your first coffee. The reflex is to fire off a support ticket or restart the server. But hold on. Nine times out of ten, the problem has a specific cause, and three minutes of structured triage will tell you exactly what it is. Skipping that step means wasting everyone's time and sometimes restarting things that didn't need restarting.
Before you touch anything, confirm whether the site is genuinely down. Structured triage takes minutes and tells you exactly where to focus your effort.
- An external availability check confirms in seconds whether the outage is visible from outside your network.
- DNS and routing problems account for a large portion of apparent downtime and are fixable in minutes once identified.
- Arriving at a support ticket with a clear, structured diagnosis cuts resolution time and eliminates unnecessary back-and-forth.
The First Question: Is It Down for Everyone or Just You?
This is always step one. Before anything else, you need to rule out that the problem exists only inside your own network. A misconfigured DNS resolver, a stale local cache, or a proxy setting gone wrong can make a healthy site look completely dead from where you're sitting.
That's where an external check changes the entire picture. Instead of assuming the server is broken, you confirm from a third-party vantage point whether the site responds at all. Running a web diagnostic from outside your network is the first real data point in this process. If it reports the site as reachable, the problem is local. If it shows the site as unreachable, you have a genuine server-side or network-side issue to investigate.
That one result decides your entire next move. It separates "flush my DNS cache" from "call the host right now."
A Step-by-Step Triage Checklist
Work through these in order. Each step either confirms the issue or rules it out. Don't skip ahead based on a hunch.
- Run an external availability check. Confirm from outside your network whether the site responds at all. Nothing else makes sense to investigate until you know whether the outage is real or local to your machine or office.
- Check your own DNS resolution. Open a terminal and run
nslookup yourdomain.comordig yourdomain.com. Compare the returned IP against what you expect. If it resolves to the wrong address, your DNS cache is stale or your resolver is returning bad data. - Flush your local DNS cache. On Linux:
sudo systemd-resolve --flush-caches. On macOS:sudo dscacheutil -flushcache. On Windows:ipconfig /flushdns. Retry the site immediately after flushing. - Try a different DNS resolver. Temporarily switch to 8.8.8.8 or 1.1.1.1 and test again. If the site loads with a different resolver, your default resolver was the culprit.
- Run a traceroute. Use
traceroute yourdomain.comon Linux and macOS, ortracert yourdomain.comon Windows. Watch for where packets stop. A hop that times out consistently points to a routing or firewall problem somewhere between you and the server. - Check the HTTP response directly. Run
curl -I https://yourdomain.comto pull raw HTTP headers. A 200 means the server responded fine. A 5xx means the application or server failed. A connection timeout means something is blocking the request before it even reaches the app layer. - Pull your server logs. If you have access, check the web server error log and the application log. A sudden flood of 502s usually points to a dead upstream service or crashed app process. A full disk can produce strange 500 errors. Your logs will tell you what actually happened.
Reading What Your Browser Error Message Actually Means
The error page your browser renders carries real diagnostic information. Phrasing varies by browser, but the underlying signals are consistent. Here's what the common ones tell you:
- ERR_NAME_NOT_RESOLVED / DNS_PROBE_FINISHED_NXDOMAIN: The domain could not be resolved at all. Either DNS is misconfigured, the domain doesn't exist yet, or your resolver is returning no result.
- ERR_CONNECTION_REFUSED: DNS worked, but nothing was listening on the expected port. The server is reachable on the network, but the service itself is down or bound to a different port than expected.
- ERR_CONNECTION_TIMED_OUT: The request went out but never got a reply. The most common causes are a firewall rule blocking the port or a completely unresponsive server process.
- 502 Bad Gateway: A proxy or load balancer received a bad response from the upstream server. The proxy is alive. Whatever sits behind it isn't.
- 503 Service Unavailable: The server is running but deliberately refusing requests. This typically points to overload, maintenance mode, or rate limiting at the application level.
HTTP status codes follow a well-defined class structure. As specified in HTTP semantics, 2xx responses signal success, 4xx signals a client-side error, and 5xx signals a server-side failure. When you see anything in the 5xx range, the server received your request and failed to process it. That points directly at the application or infrastructure, not at DNS or routing. The fix lives somewhere different for each class.
When DNS Is the Actual Culprit
DNS problems are common. They look alarming but are usually fast to resolve once identified. The most typical scenario is a recent record change that hasn't propagated to all resolvers.
Every DNS record carries a TTL value, measured in seconds. If you recently changed an A record from an old IP to a new one, resolvers that already cached the old record won't pick up the change until that TTL expires. For a TTL of 3600, that's a full hour of stale data hitting some users. They'll reach the old server until the cache refreshes naturally.
Check your current DNS records from multiple public resolvers. If your DNS host shows the correct IP but some resolvers still return the old address, propagation is simply in progress and you wait it out. If your own DNS host is returning incorrect data, that's where you need to focus your fix, not the server itself.
Routing Problems and How to Spot Them
Sometimes the site is genuinely up, DNS resolves correctly, but traffic still can't get through. A firewall rule change, a BGP routing issue upstream, or a misconfigured security group in a cloud environment can all cause this. From the outside, it looks identical to a server being completely offline.
Traceroute output is your clearest signal. Each line represents one network hop. Consistent timeouts starting at a specific hop tell you exactly where the path breaks. If the last successful hop is inside the data center and the next is where it drops, the problem is at the host level. If it drops at a mid-network hop, the issue is upstream and outside your direct control.
One important note on interpretation: packet loss at an intermediate hop that isn't the final destination doesn't always mean trouble. Some routers deprioritize ICMP traffic under load. What matters is consistent, repeated loss specifically at the destination hop, not a single asterisk mid-route.
What a Genuine Server Failure Looks Like
If an external check confirms the site is unreachable, DNS resolves correctly, traceroute reaches the host, but curl shows a connection refused or a hard timeout at the final destination, the failure is almost certainly on the server itself.
The most common causes at this stage are the web server process crashing without automatic restart, an application running out of memory and being killed by the kernel, a deployment breaking the startup sequence, a disk that filled up preventing log writes and file serving, or a certificate renewal failure that dropped the HTTPS listener entirely.
Check whether the process is running: systemctl status nginx, pm2 status, or whatever process manager your stack uses. Check available memory with free -h. Check disk space with df -h. The answer is in one of those places the vast majority of the time, and each one takes about ten seconds to check.
When You Have Enough to Stop Debugging and Open That Ticket
At this point you've either fixed the issue, or you have a precise picture of where the failure is. Both outcomes are valuable. A support ticket that says "the site is down" wastes everyone's time and triggers a full loop of questions before anyone starts work. A ticket that says "external availability check confirms unreachable from outside our network, DNS resolves correctly to 192.0.2.10, traceroute drops at the datacenter edge, server process log shows OOM kill in the last 10 minutes" gets escalated and resolved in a fraction of the time.
Structured triage isn't just about speed. It's about precision. The difference between a 20-minute incident and a 3-hour one usually comes down to whether the person who can fix it receives the right information upfront. That three-minute checklist before filing the ticket is exactly what makes that happen consistently.